
Crunchy Bits
Sleuthing in Lockdown - an unusual project by Laura Storm & Mark Harris
17/09/2020
“Data! Data! Data! I can’t make bricks without clay!”
(Sherlock Holmes)
There it is in a sleuth’s nutshell. The very best way to solve a mystery is to analyse the facts. Take what you know to be true, rearrange the details, and extract the good stuff. Clay, in this instance, is the miniature encyclopaedia that is the Underwater Photographer of the Year’s 2020 Yearbook. Its foundations are built on stunning awarded photographs from the four corners of our watery planet. But there’s more - much more - concealed in the beautifully presented annual. The bricks are not what you think they are. Behind the talent and winning images lies a cookie-crumb trail of evidence. Clues that reveal fascinating facts. Hidden within the captions are other stories, unusual connections, and quirky trends not immediately obvious to a casual observer - let alone the judges and entrants. So what are these mysteries and how did we get here?
PLANET VIRUS
With the walls closing in and a key project in lockdown-limbo, what better way to kill time than to kick off a new venture? Something absorbing which, in the typical ebb and flow of life, wouldn’t ordinarily be possible. Data crunching! Now, I know what you might be thinking but hang in there. I’m talking about gold-dust information that may just spark innovation. Valuable insights like patterns and trends – tools to predict the future. And left-of-centre observations that might help raise your game. I must admit that none of these things were on my mind when I started this information love affair. As it happens, I was hunting creative ideas for artistic assignments – a masterclass, some articles, my conservation project. Just a few specifics, nuggets rather than an entire gold mine. But as you’ll discover, the more you torture the data, the more it gives.
I should also mention a hidden asset, the best partner-in-crime a fledgling detective could have, my husband, Mark. As luck would have it, Mark is adept at data analytics. So on a fine, hazy day with the world in meltdown, we set about designing a database. A comprehensive system that enabled us to Extract, Transform, and Load as much relevant information from the Yearbook that we could find.
Weeks of input later, the framework was ready. We began mining the data in a variety of ways, hoping to find the key to some hotly debated questions. Are some destinations or subjects more likely to produce a winning image? Is there anything formulaic about our settings? Do we have a recognisable footprint? And if we do, will that style go in our favour or against it? Does unconscious bias play a part in selecting our submissions? What hasn’t been photographed and why? How do you jump the shark? Does it matter which camera you use? All these questions and more were in the mix.
With the clock ticking down to freedom, we added more and more fields and looked for answers beyond the obvious. Mark and I developed visual infographics to represent some of our findings. In turn, these helped identify patterns and microtrends. Throughout our ‘Crunchy Bits’ case study, we questioned and discussed the results, drilled deeper to access more information, applied reasoning and logic, and have been amazed at our findings. We hope you will be too.
HEAD ABOVE THE CLOUDS
Let’s start with something fun, because data crunching, as you’ll discover, is that and more. Floating in the Shark Cloud are subjects captured in the 2020 awarded images. For simplicity, singular subjects have been grouped together (categorised collectively) – such as fish, shrimps, or crabs. We determined that if a subject was especially popular, like gobies and blennies, they deserved to feature in their own right.

Only the principal subject from each image is included in the Shark Cloud. If an image showed more than one subject, the relevant data (if not obvious) was determined from caption details or judging comments. There was one exception of two subjects, which were stuck together appearing as one, and both were therefore included in the cloud.
Subject popularity increased the word size and so we can deduce that fish lead the way in leaps and bounds. Followed next by sharks, wrecks, and models. Since wrecks have their own category they are included as a useful yardstick measurement (11 images in total featured wrecks).
Delving further, in a world where invertebrates are on the rise, it’s vertebrates that dominated (as prime subjects). You will have noticed the subjects in the cloud are further classified by colour. Each colour represents a basic taxonomy group, a plant, something man-made, or a natural formation. Vertebrates comprise fish, reptiles, amphibians, birds, and mammals. And invertebrates include crustaceans, molluscs, cnidarians, and so on. The basic taxonomy group that prevailed in this way were fish; sharks, rays, fish, blennies, gobies, eels, seahorses.
Our planet is experiencing the sixth mass extinction event, so are we consciously or unconsciously highlighting this in our images? Are we photographing charismatic animals while we can - or is it more fundamental in that they simply make for a stronger emotional connection, one that resonates with the judges? In 2020, each of the Grand Awards featured vertebrates. 100% of the Portrait category subjects and 90% of Marine Conservation ‘stories’ featured backboned animals.
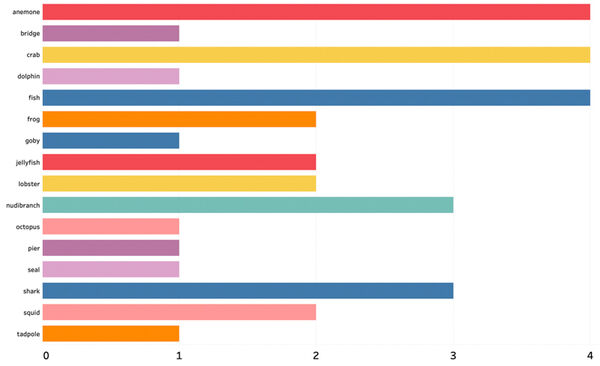
Within the British categories, it’s a different story. Invertebrates sneak ahead and we’ve shown that data numerically in this bar chart:
When we combined the international and British Waters categories, the overall trend is still clearly obvious.
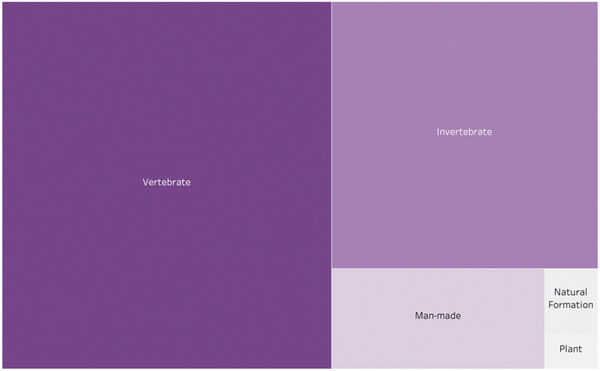
Our treemap above shows that vertebrates pack a punch.
COMPETITOR GLOW
I once read that if you win an award in a photography competition, you are statistically more likely to win again at some point in your journey (as a contestant). So, is that true?
Looking at awards picked up by each photographer, this pie chart shows all the competition entrants with their awarded image count. The range is between one and six.

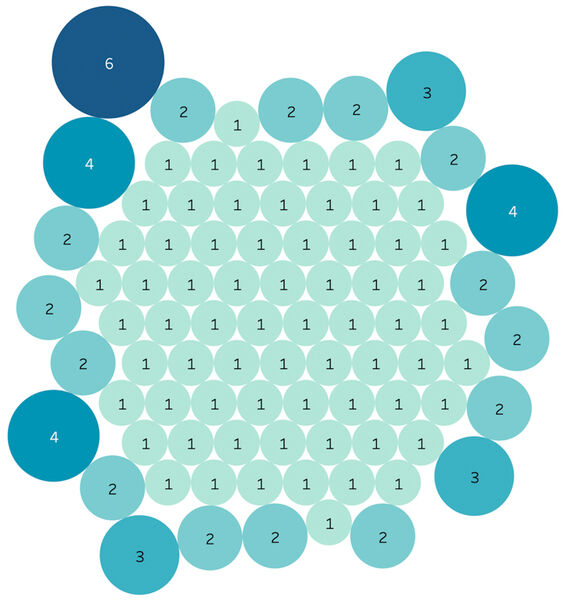
An alternative view of the same information is shown in this bubble chart. Note that the magic number of five images has been exceeded by one photographer, but attained by no one.
An amazing 17% of entrants succeeded with more than one image in this year’s awards. If you then look at the wider picture to include previous UPY winners, as well as other big-hitting events, the percentage goes up exponentially. That’s not to say that every year a competing photographer does well. On the contrary, there are lean years for many. But the stars shine favourably if you have already made the grade in a high-calibre competition.
WORLDS APART, OCEANS TOGETHER
Next, there are two world charts. For these, British category images have initially been disregarded, to focus on and show an accurate international view. Our first map shows the country of origin for each photographer awarded in an international category. Circle size indicates the relative count of citizen shooters, based on numbers of photographers rather than a total tally of awarded images.

This second chart indicates where images were predominantly taken i.e. the host country (rather than specifics like dive site, island, or region). Again, and for continuity, we have disregarded the British categories in the map detail.

Some interesting facts emerge when data from the two world maps are combined.
We looked at the destinations where awarded photographers had travelled to capture their images and found that fewer host countries produced photographers that captured winning images in home waters. There were 11 (including now the UK) that did, which is about a third of the total. Italy had five, Australia four, and another eight countries had single images. These were Canada, China, Japan, Norway, Spain, Switzerland, Taiwan and the USA. Of this group, just Norway, Italy and the USA were destinations of choice for visiting photographers.
The maps show how we criss-cross around the globe in a peripatetic pattern, chasing dreams and wildlife encounters. It will be interesting to see what happens next year. With so many borders still closed, and flights grounded, will the pandemic encourage a surge in home-turf entries?
The most popular international destination was Indonesia with 18 images on the leader-board, yet no Indonesian photographers succeeded this year. Medal counts amassed from other parts of the Coral Triangle, with the Philippines coming in 2nd, totalling 11 ‘location’ awards. Altogether, our version of an Olympic style board featured 32 host countries (again including the UK) and 27 nationalities. Ironically, the single awarded image taken by the photographer from the Philippines was actually captured in Indonesia. Likewise, South Africa was a winning destination, but the two South African owned images were taken in Mauritius.
Combining data from the two world maps revealed a balanced spread of movement - shown in this bubble chart. The exception is the big red 33, which represents British Waters. While British photographers travelled to other countries and succeeded internationally, no other nationalities featured in the British Waters categories. Only UK photographers captured images in UK waters. This highlights why we initially removed that data from the world maps.

Each circle shows the one-to-one mapping of a country with either a) citizen photographers or b) visiting photographers. The numbers show an image count for each mapping. For example, if a country had two images taken by photographers from two separate countries, then it will have two bubbles of 1. Mexico was a country that did well as a destination, producing four bubbles of photographers from four different countries. Bubbles with higher numbers are mostly from countries with home-turf, citizen photographers but not always. America did really well in our bubble scheme, scooping 12 awards from 12 different photographers, taken in 10 different countries – including territorial waters. Therefore lots of bubbles of 1 and 2 bubbles of 2 were generated.
THIRD-EYE ACTION
If you’re stuck in a perpetual, or procrastinating, upgrade loop - the one where a higher spec model forever supersedes your dream camera – this section is for you. If you hold back from submitting great work because you think your camera doesn’t make the grade, then read on.
When it comes to competition images, it shouldn’t matter which camera you use, it’s what you do with it that counts. Artistic vision, creativity, imagination, ingenuity and innovation, a little luck, never giving up – these are just some of the traits shared by the winning photographers.
On the other hand, it is perfectly reasonable to look at the equipment in a different light, where photographers of a certain calibre (and experience), have made investment choices. This paints an interesting picture and one worth considering rather than the optimistic view that a simple purchase of the most popular camera or housing will yield winning results in their own right.
Either way, let’s ask the data!
Based on release dates, the oldest model used to capture a winning image in the UPY 2020 awards, was 12 yrs. - a Canon 5D MkII. The youngest, at 3 yrs. was a Nikon D850. Canon shooters had the widest range of models, 14 in all vs. Nikon shooters with 11.

In our doughnut above, you can see the different camera makes and their respective count for the 123 images in the Yearbook’s collection.
Every now and then a particular camera breaks new ground. That translates into a high demand product and to longevity. This became apparent by looking at the release dates of every camera used. Canon shooters on average used older cameras than Nikon. Variants of their 5D model captured 36 of the 53 Canon images. And Nikon’s D500 model accounted for 14 winners, followed by the D850 with 10. In the international categories, Canon took podium place. However, the Canon vs. Nikon rivalry reverses popularity in the British categories, where Nikon emerged top with 13 images against Canon’s 11. Even so, the most successful camera model amongst the Brit pack was neither a Nikon nor a DSLR, it was a Canon compact, the G7X mk2 producing 7 images from two different photographers.
We put together a Top 10 of housings and, like a sleek greyhound, first off the starter’s block and halfway round the track is Nauticam. Below, the chart shows that with housings it’s a game of two halves, with the sum of the rest collectively matching the lion’s share:

And finally, a little lens talk! Our avocado treetable (below) highlights a top 12, rather than 10, to be more inclusive. We haven't included unclassified or built-in lenses, because we're essentially interested in known detachable lenses.

The Tokina 10-17mm Fisheye was the 2nd favourite, it is a lens most suited to APS-C DSLRs and can be configured to mount on both Canon and Nikon. Here, for 8 out of 12 images, it was used on the Nikon D500. The only image where it was used with a Canon was a 5D MkIII, which has a full-frame sensor.
The top 12 only accounts for 55% of the images. Not all photographers supplied the make of their lens, and there were many images captured with unique lenses or lens combinations (Super-macro / diopters and such).
KOOKY FACTS, OUTLIERS AND MICROTRENDS
Last but not least, some interesting facts, figures, and food for thought:
* The two images with the slowest and fastest shutter speeds, were both made by
the same photographer.
* Looking at apertures, the three images with the widest settings were all captured by the same photographer.
* In the ‘golden triangle’ of ISO, shutter speed, and aperture – all three elements independently had value ranges of over 20 different settings.
* 95 of the 123 winning images were captured using shutter speeds of 1/100 or faster. And 87 out of the 123 photographs had an ISO setting between 100 – 400.
* The Male / Female split has consistently been around 80% (male) and 20% (female) over the last six years. It dipped a little last year but in 2020 the ladies
inched up again to take 21% of the awards.
* Of UPY 2020 images, 86% were taken in saltwater, 11% fresh, and 3% out the water (with one being a hybrid).
Combining the most common of some of the significant attributes we identified would provide a single image as follows:
A fish (other than a shark, blenny, goby, eel, or seahorse), taken with a Canon EOS 5D in a Nauticam housing, using a Canon 8-15mm fisheye lens, with natural light, at ISO 200, f/11, and 1/200.
Combining the most unique of some of the significant attributes we uncovered could provide a single image as follows:
A hippopotamus, taken with a Hasselblad X1D 50C in a custom-made housing, using a Hasselblad XCD 120mm macro lens and Scubalamp PV22 light, at ISO 219, f/2.8, and 1/640. (This example has several variations that could be substituted, and may well need to in order to produce a viable image!).
FINAL THOUGHTS
Lockdown is easing; work and normal life beckon. Our days obsessing over Crunchy Bits have drawn to a close. We could keep going, the data still talks. For this article, we have cherry-picked a selection of technical insights to share with you. For those who enter competitions, we hope they’re of interest. And if you’ve been hanging back, then maybe this will encourage you to leap into the fray, trust in the kit you know and love, buck the trends. And if you can read between the lines, you’ll know just how to jump the shark!

First published in Underwater Photography Magazine, Issue 116 (Sept / Oct 2020)
UwP article can be found here.
(Sherlock Holmes)
There it is in a sleuth’s nutshell. The very best way to solve a mystery is to analyse the facts. Take what you know to be true, rearrange the details, and extract the good stuff. Clay, in this instance, is the miniature encyclopaedia that is the Underwater Photographer of the Year’s 2020 Yearbook. Its foundations are built on stunning awarded photographs from the four corners of our watery planet. But there’s more - much more - concealed in the beautifully presented annual. The bricks are not what you think they are. Behind the talent and winning images lies a cookie-crumb trail of evidence. Clues that reveal fascinating facts. Hidden within the captions are other stories, unusual connections, and quirky trends not immediately obvious to a casual observer - let alone the judges and entrants. So what are these mysteries and how did we get here?
PLANET VIRUS
With the walls closing in and a key project in lockdown-limbo, what better way to kill time than to kick off a new venture? Something absorbing which, in the typical ebb and flow of life, wouldn’t ordinarily be possible. Data crunching! Now, I know what you might be thinking but hang in there. I’m talking about gold-dust information that may just spark innovation. Valuable insights like patterns and trends – tools to predict the future. And left-of-centre observations that might help raise your game. I must admit that none of these things were on my mind when I started this information love affair. As it happens, I was hunting creative ideas for artistic assignments – a masterclass, some articles, my conservation project. Just a few specifics, nuggets rather than an entire gold mine. But as you’ll discover, the more you torture the data, the more it gives.
I should also mention a hidden asset, the best partner-in-crime a fledgling detective could have, my husband, Mark. As luck would have it, Mark is adept at data analytics. So on a fine, hazy day with the world in meltdown, we set about designing a database. A comprehensive system that enabled us to Extract, Transform, and Load as much relevant information from the Yearbook that we could find.
Weeks of input later, the framework was ready. We began mining the data in a variety of ways, hoping to find the key to some hotly debated questions. Are some destinations or subjects more likely to produce a winning image? Is there anything formulaic about our settings? Do we have a recognisable footprint? And if we do, will that style go in our favour or against it? Does unconscious bias play a part in selecting our submissions? What hasn’t been photographed and why? How do you jump the shark? Does it matter which camera you use? All these questions and more were in the mix.
With the clock ticking down to freedom, we added more and more fields and looked for answers beyond the obvious. Mark and I developed visual infographics to represent some of our findings. In turn, these helped identify patterns and microtrends. Throughout our ‘Crunchy Bits’ case study, we questioned and discussed the results, drilled deeper to access more information, applied reasoning and logic, and have been amazed at our findings. We hope you will be too.
HEAD ABOVE THE CLOUDS
Let’s start with something fun, because data crunching, as you’ll discover, is that and more. Floating in the Shark Cloud are subjects captured in the 2020 awarded images. For simplicity, singular subjects have been grouped together (categorised collectively) – such as fish, shrimps, or crabs. We determined that if a subject was especially popular, like gobies and blennies, they deserved to feature in their own right.
Only the principal subject from each image is included in the Shark Cloud. If an image showed more than one subject, the relevant data (if not obvious) was determined from caption details or judging comments. There was one exception of two subjects, which were stuck together appearing as one, and both were therefore included in the cloud.
Subject popularity increased the word size and so we can deduce that fish lead the way in leaps and bounds. Followed next by sharks, wrecks, and models. Since wrecks have their own category they are included as a useful yardstick measurement (11 images in total featured wrecks).
Delving further, in a world where invertebrates are on the rise, it’s vertebrates that dominated (as prime subjects). You will have noticed the subjects in the cloud are further classified by colour. Each colour represents a basic taxonomy group, a plant, something man-made, or a natural formation. Vertebrates comprise fish, reptiles, amphibians, birds, and mammals. And invertebrates include crustaceans, molluscs, cnidarians, and so on. The basic taxonomy group that prevailed in this way were fish; sharks, rays, fish, blennies, gobies, eels, seahorses.
Our planet is experiencing the sixth mass extinction event, so are we consciously or unconsciously highlighting this in our images? Are we photographing charismatic animals while we can - or is it more fundamental in that they simply make for a stronger emotional connection, one that resonates with the judges? In 2020, each of the Grand Awards featured vertebrates. 100% of the Portrait category subjects and 90% of Marine Conservation ‘stories’ featured backboned animals.
Within the British categories, it’s a different story. Invertebrates sneak ahead and we’ve shown that data numerically in this bar chart:
When we combined the international and British Waters categories, the overall trend is still clearly obvious.
Our treemap above shows that vertebrates pack a punch.
COMPETITOR GLOW
I once read that if you win an award in a photography competition, you are statistically more likely to win again at some point in your journey (as a contestant). So, is that true?
Looking at awards picked up by each photographer, this pie chart shows all the competition entrants with their awarded image count. The range is between one and six.
An alternative view of the same information is shown in this bubble chart. Note that the magic number of five images has been exceeded by one photographer, but attained by no one.
An amazing 17% of entrants succeeded with more than one image in this year’s awards. If you then look at the wider picture to include previous UPY winners, as well as other big-hitting events, the percentage goes up exponentially. That’s not to say that every year a competing photographer does well. On the contrary, there are lean years for many. But the stars shine favourably if you have already made the grade in a high-calibre competition.
WORLDS APART, OCEANS TOGETHER
Next, there are two world charts. For these, British category images have initially been disregarded, to focus on and show an accurate international view. Our first map shows the country of origin for each photographer awarded in an international category. Circle size indicates the relative count of citizen shooters, based on numbers of photographers rather than a total tally of awarded images.
This second chart indicates where images were predominantly taken i.e. the host country (rather than specifics like dive site, island, or region). Again, and for continuity, we have disregarded the British categories in the map detail.
Some interesting facts emerge when data from the two world maps are combined.
We looked at the destinations where awarded photographers had travelled to capture their images and found that fewer host countries produced photographers that captured winning images in home waters. There were 11 (including now the UK) that did, which is about a third of the total. Italy had five, Australia four, and another eight countries had single images. These were Canada, China, Japan, Norway, Spain, Switzerland, Taiwan and the USA. Of this group, just Norway, Italy and the USA were destinations of choice for visiting photographers.
The maps show how we criss-cross around the globe in a peripatetic pattern, chasing dreams and wildlife encounters. It will be interesting to see what happens next year. With so many borders still closed, and flights grounded, will the pandemic encourage a surge in home-turf entries?
The most popular international destination was Indonesia with 18 images on the leader-board, yet no Indonesian photographers succeeded this year. Medal counts amassed from other parts of the Coral Triangle, with the Philippines coming in 2nd, totalling 11 ‘location’ awards. Altogether, our version of an Olympic style board featured 32 host countries (again including the UK) and 27 nationalities. Ironically, the single awarded image taken by the photographer from the Philippines was actually captured in Indonesia. Likewise, South Africa was a winning destination, but the two South African owned images were taken in Mauritius.
Combining data from the two world maps revealed a balanced spread of movement - shown in this bubble chart. The exception is the big red 33, which represents British Waters. While British photographers travelled to other countries and succeeded internationally, no other nationalities featured in the British Waters categories. Only UK photographers captured images in UK waters. This highlights why we initially removed that data from the world maps.
Each circle shows the one-to-one mapping of a country with either a) citizen photographers or b) visiting photographers. The numbers show an image count for each mapping. For example, if a country had two images taken by photographers from two separate countries, then it will have two bubbles of 1. Mexico was a country that did well as a destination, producing four bubbles of photographers from four different countries. Bubbles with higher numbers are mostly from countries with home-turf, citizen photographers but not always. America did really well in our bubble scheme, scooping 12 awards from 12 different photographers, taken in 10 different countries – including territorial waters. Therefore lots of bubbles of 1 and 2 bubbles of 2 were generated.
THIRD-EYE ACTION
If you’re stuck in a perpetual, or procrastinating, upgrade loop - the one where a higher spec model forever supersedes your dream camera – this section is for you. If you hold back from submitting great work because you think your camera doesn’t make the grade, then read on.
When it comes to competition images, it shouldn’t matter which camera you use, it’s what you do with it that counts. Artistic vision, creativity, imagination, ingenuity and innovation, a little luck, never giving up – these are just some of the traits shared by the winning photographers.
On the other hand, it is perfectly reasonable to look at the equipment in a different light, where photographers of a certain calibre (and experience), have made investment choices. This paints an interesting picture and one worth considering rather than the optimistic view that a simple purchase of the most popular camera or housing will yield winning results in their own right.
Either way, let’s ask the data!
Based on release dates, the oldest model used to capture a winning image in the UPY 2020 awards, was 12 yrs. - a Canon 5D MkII. The youngest, at 3 yrs. was a Nikon D850. Canon shooters had the widest range of models, 14 in all vs. Nikon shooters with 11.
In our doughnut above, you can see the different camera makes and their respective count for the 123 images in the Yearbook’s collection.
Every now and then a particular camera breaks new ground. That translates into a high demand product and to longevity. This became apparent by looking at the release dates of every camera used. Canon shooters on average used older cameras than Nikon. Variants of their 5D model captured 36 of the 53 Canon images. And Nikon’s D500 model accounted for 14 winners, followed by the D850 with 10. In the international categories, Canon took podium place. However, the Canon vs. Nikon rivalry reverses popularity in the British categories, where Nikon emerged top with 13 images against Canon’s 11. Even so, the most successful camera model amongst the Brit pack was neither a Nikon nor a DSLR, it was a Canon compact, the G7X mk2 producing 7 images from two different photographers.
We put together a Top 10 of housings and, like a sleek greyhound, first off the starter’s block and halfway round the track is Nauticam. Below, the chart shows that with housings it’s a game of two halves, with the sum of the rest collectively matching the lion’s share:
And finally, a little lens talk! Our avocado treetable (below) highlights a top 12, rather than 10, to be more inclusive. We haven't included unclassified or built-in lenses, because we're essentially interested in known detachable lenses.
The Tokina 10-17mm Fisheye was the 2nd favourite, it is a lens most suited to APS-C DSLRs and can be configured to mount on both Canon and Nikon. Here, for 8 out of 12 images, it was used on the Nikon D500. The only image where it was used with a Canon was a 5D MkIII, which has a full-frame sensor.
The top 12 only accounts for 55% of the images. Not all photographers supplied the make of their lens, and there were many images captured with unique lenses or lens combinations (Super-macro / diopters and such).
KOOKY FACTS, OUTLIERS AND MICROTRENDS
Last but not least, some interesting facts, figures, and food for thought:
* The two images with the slowest and fastest shutter speeds, were both made by
the same photographer.
* Looking at apertures, the three images with the widest settings were all captured by the same photographer.
* In the ‘golden triangle’ of ISO, shutter speed, and aperture – all three elements independently had value ranges of over 20 different settings.
* 95 of the 123 winning images were captured using shutter speeds of 1/100 or faster. And 87 out of the 123 photographs had an ISO setting between 100 – 400.
* The Male / Female split has consistently been around 80% (male) and 20% (female) over the last six years. It dipped a little last year but in 2020 the ladies
inched up again to take 21% of the awards.
* Of UPY 2020 images, 86% were taken in saltwater, 11% fresh, and 3% out the water (with one being a hybrid).
Combining the most common of some of the significant attributes we identified would provide a single image as follows:
A fish (other than a shark, blenny, goby, eel, or seahorse), taken with a Canon EOS 5D in a Nauticam housing, using a Canon 8-15mm fisheye lens, with natural light, at ISO 200, f/11, and 1/200.
Combining the most unique of some of the significant attributes we uncovered could provide a single image as follows:
A hippopotamus, taken with a Hasselblad X1D 50C in a custom-made housing, using a Hasselblad XCD 120mm macro lens and Scubalamp PV22 light, at ISO 219, f/2.8, and 1/640. (This example has several variations that could be substituted, and may well need to in order to produce a viable image!).
FINAL THOUGHTS
Lockdown is easing; work and normal life beckon. Our days obsessing over Crunchy Bits have drawn to a close. We could keep going, the data still talks. For this article, we have cherry-picked a selection of technical insights to share with you. For those who enter competitions, we hope they’re of interest. And if you’ve been hanging back, then maybe this will encourage you to leap into the fray, trust in the kit you know and love, buck the trends. And if you can read between the lines, you’ll know just how to jump the shark!
The Dream Team
First published in Underwater Photography Magazine, Issue 116 (Sept / Oct 2020)
UwP article can be found here.